| « Rime, freezing fog, and crystalline spider webs | Hair Ice on Wood and Pavement » |
Frost Days and Ice Days: Declining Numbers over the Century
David Easterling recently reported in BAMS** that the number of frost days per year is decreasing over the US. A frost day is a day in which the minimum temperature goes below the melting temperature of ice (32 F or 0 C). This doesn't sound good for a frost observer like me. Moreover, the largest decrease, a value of 2.6 fewer days per year per decade, is in my area, the Pacific Northwest. Will frost soon be a threatened species?
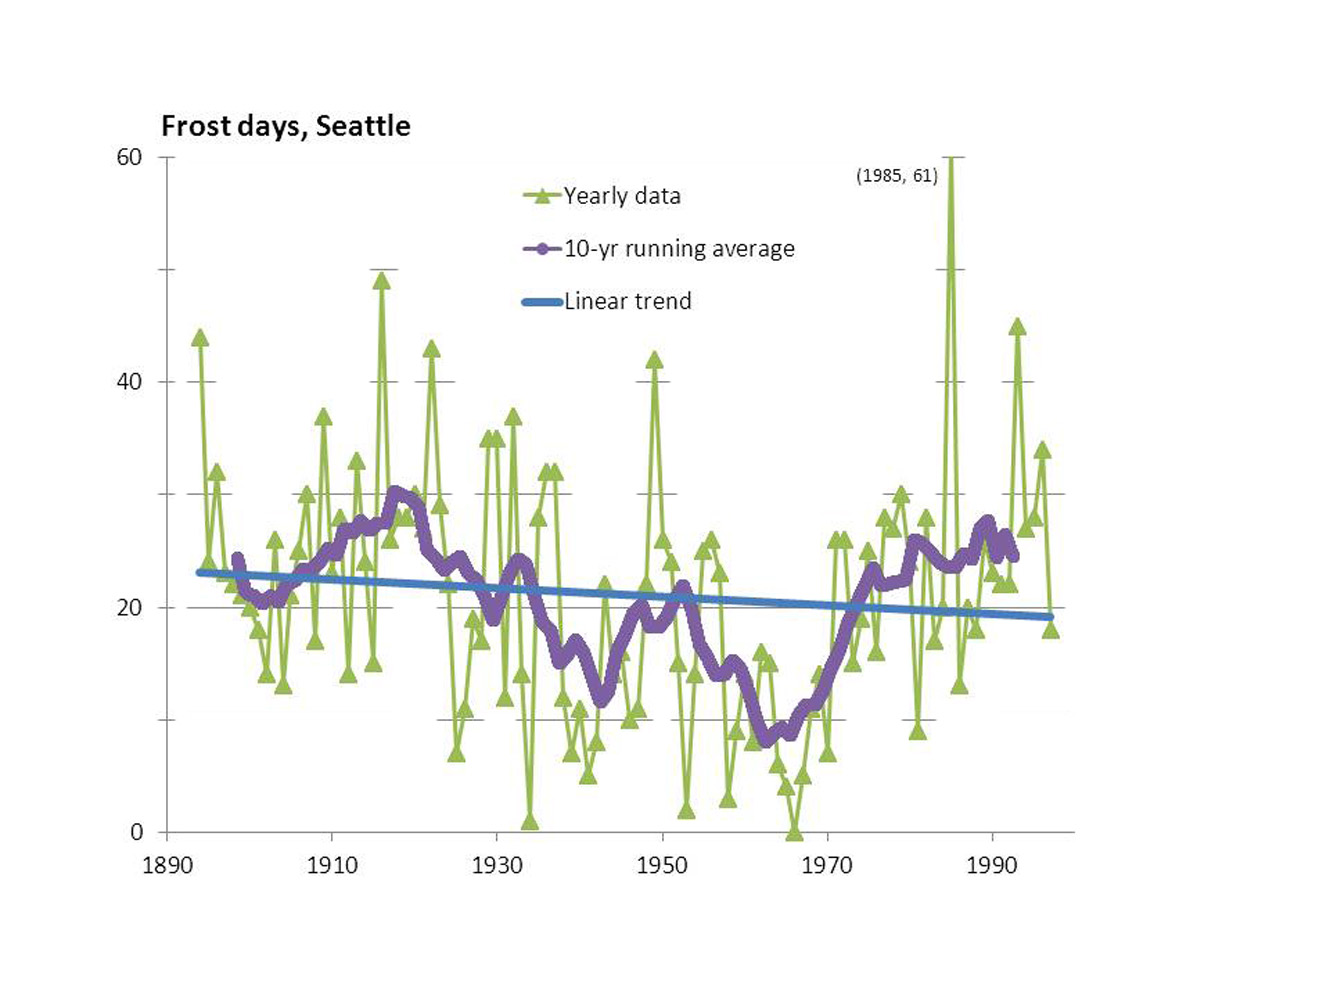
His analysis and presentation was based on 1948-1999 data, and moreover, he averaged over multi-state regions. I'm more interested in my local area, King County, Washington, and would like to see both the longer-term trend and variability. I quickly sent him an email, requesting more info. But I was impatient and sought the raw data myself. Following the info in his article, I found the data online***. An added plus: at many stations, the data now goes back another 50 years. With a few simple commands typed into an Excel spreadsheet, I determined the longer-term trend for a station near the University of Washington stadium in Seattle (the only such site in Seattle).
The data shows huge variability, with one year differing over 100% from the previous. For example, in 1985 at this station, there were a record 61 frost days, but the next year had only 13. More importantly, the overall trend from 1894 through 1997 is a measly 0.38 fewer days of frost per year per decade. Maybe frost is safe after all!
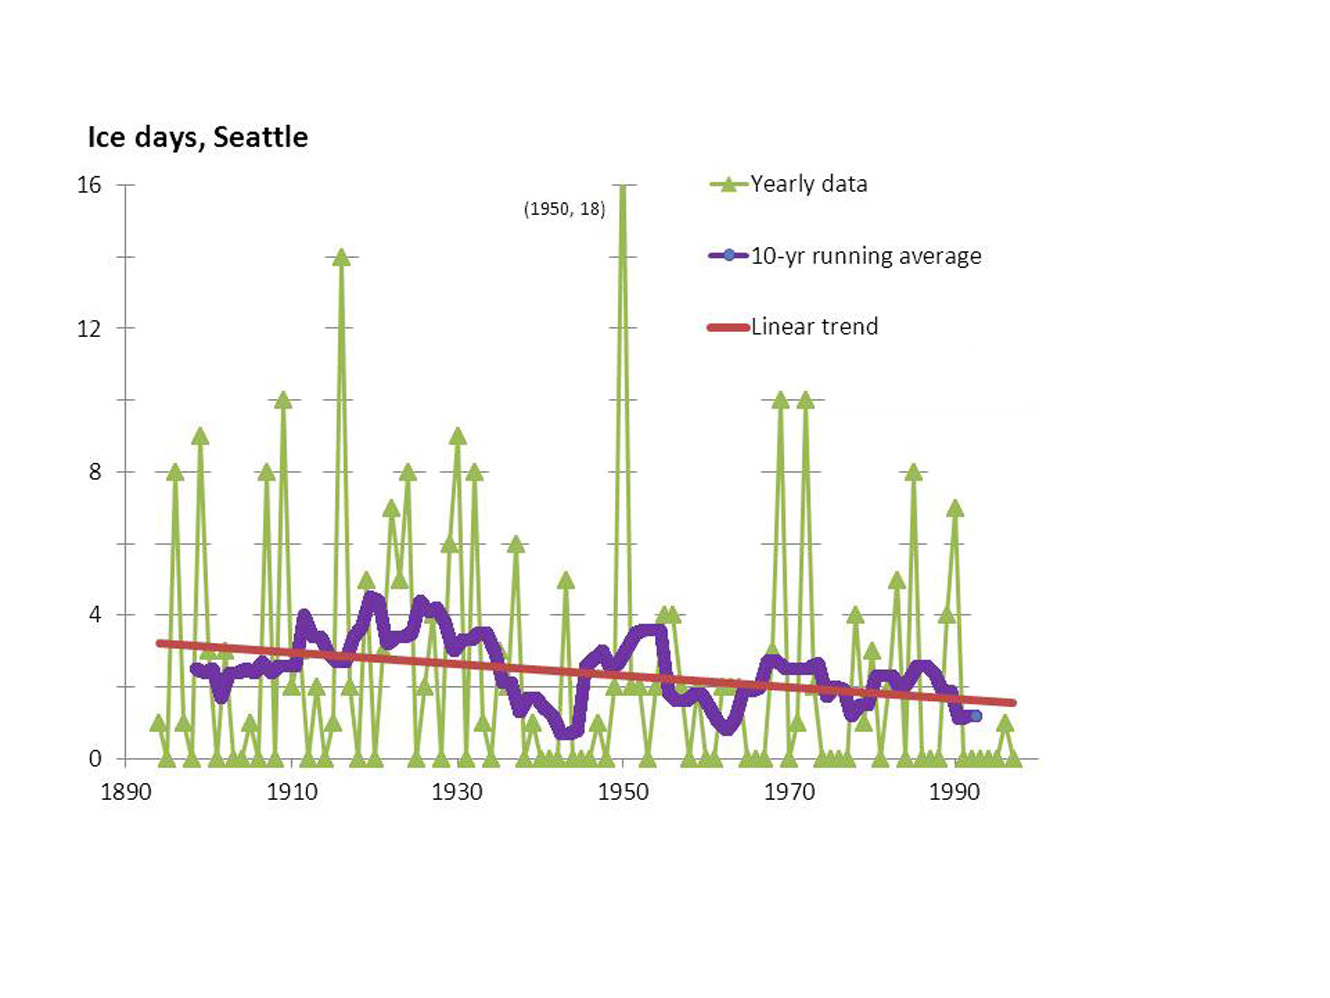
David didn't publish any analysis of the yearly number of "ice days", or the days in which the temperature never exceeded melting (i.e., stayed below 32 F). But as an avid ice-spotter, I was curious about this as well. Here is the data from the same station:
The greatest number of ice days over that period was in 1950, which had 18 such days. 1985, the record frost year with 61 frost days, had only 8 ice days. And in general, the number of ice days are much less than the number of frost days. Moreover, the trend is more clearly decreasing: The linear trend for frost days intersects "0" in the year 2504, whereas that for ice days intersects in 2094.
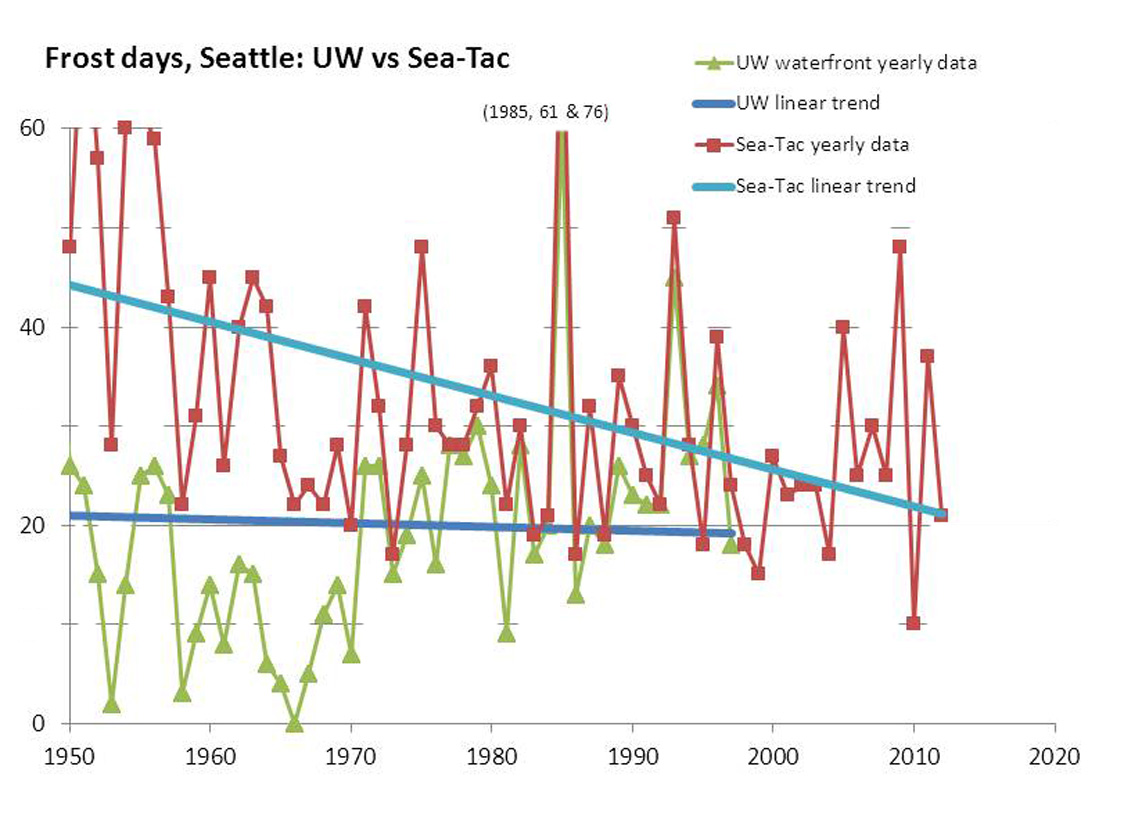
But there is quite a variability in location as well. The long-term data had only one site in Seattle, but another Seattle site has data from 1949 through the present. This other site is at Sea-Tac airport, which is further from the water and higher up. In the plot below, I compare the two locations.
In the 1950s, Sea-Tac had about twice the number of frost days as the site further north at the UW. But now, the two sites have about the same number. Here, at least, the number of frost days are decreasing at a rate above the average number reported by David Easterling. If we extend the linear fit, the number of frost days would be zero in 2069.
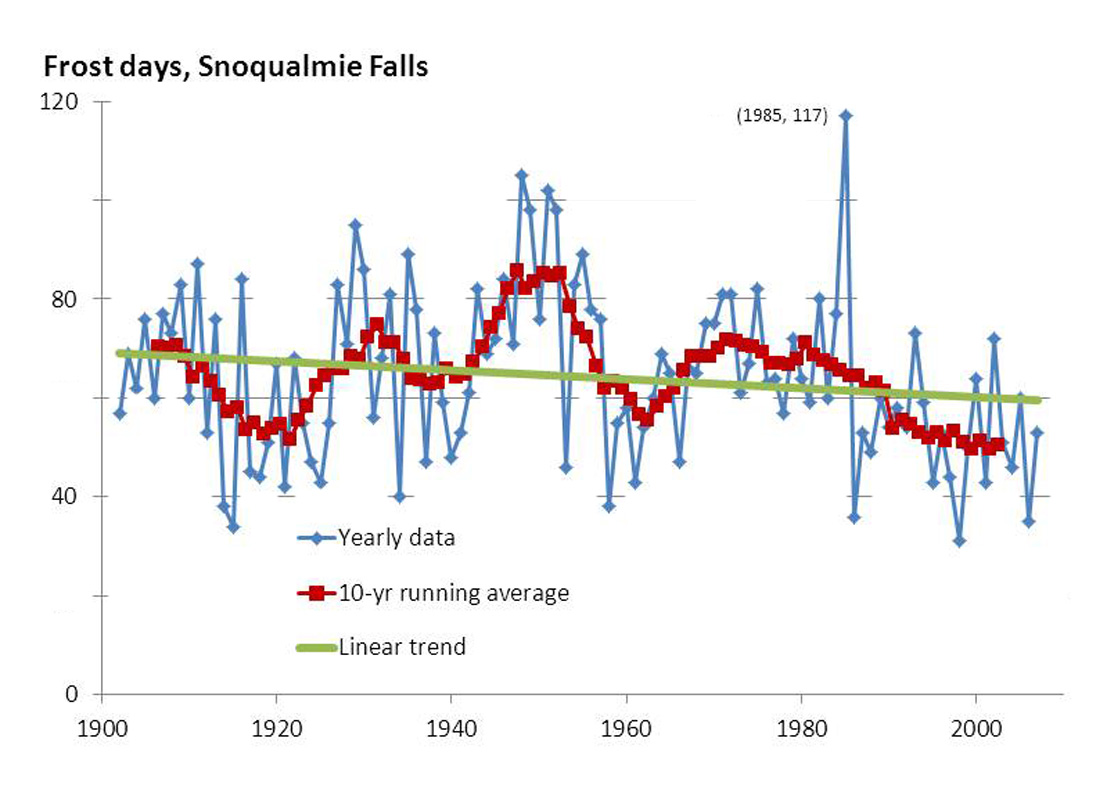
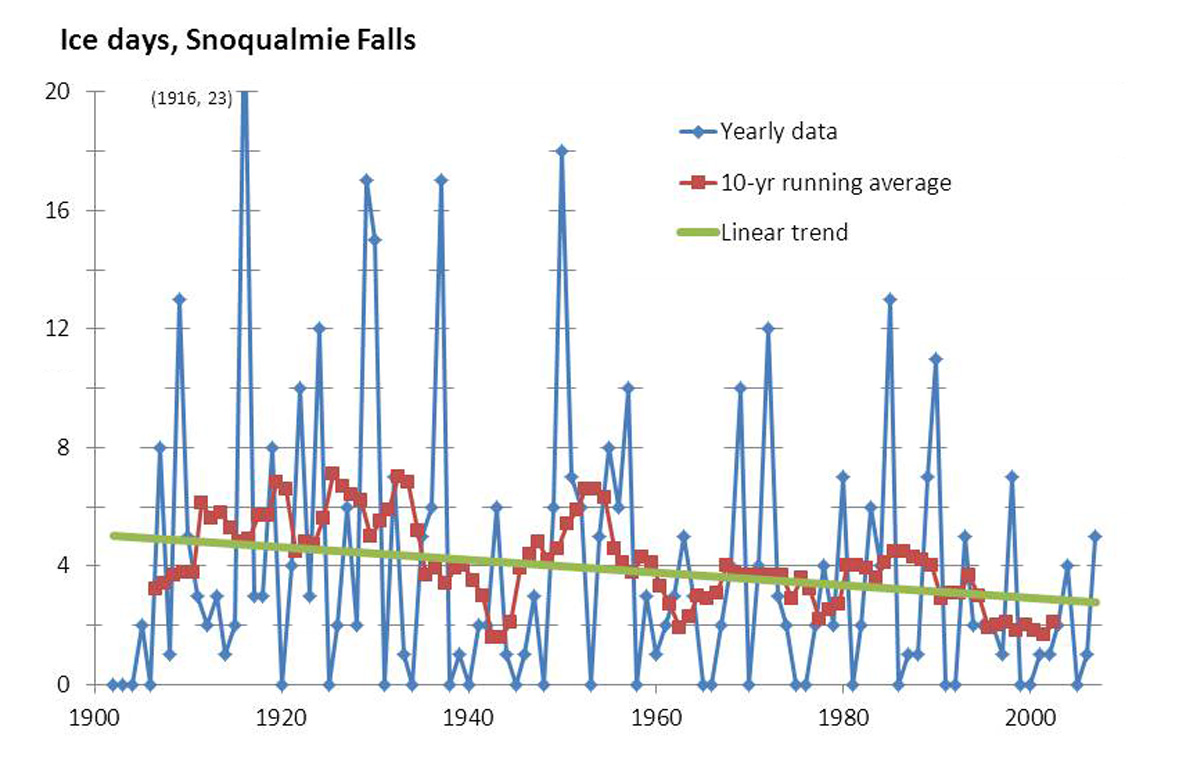
At Snoqualmie Falls, a site closer to the Cascade Mountains (about 25 miles east of the UW Seattle site), the number of frost and ice days are greater, and show a somewhat sharper trend.
Snoqualmie Falls has about twice the number of Frost days. For example, in the record year of 1985, they had 117, to Seattle's 61. And although the decrease is greater per decade than the first site in Seattle, at 0.89 days, the "zero year", where the linear trend hits "0" is about the same.
A similar story holds for the ice days at Snoqualmie Falls.
Again, the number is about twice that of the first site in Seattle. And the trend gives a zero year that is also about the same as that for Seattle.
I will just add three brief comments.
1) The trends into the future are pretty meaningless given the wide variability of the phenomena and the accelerating nature of global warming. Appreciate ice and frost formations whenever you can.
2) A frost day is only a guide to the number of days one can observe hoar or film-frost, whereas an ice day is only a rough guide to the number of days one can observe thicker masses of ice such a frozen puddles, ponds, and icicles.
3) The number of frost days is not decreasing everywhere. David shows a slight increase in the southeastern states. Closer to home, I found the number of frost and ice days to be slightly increasing in Spokane, WA. But averaged together, the numbers for the US as a whole, and as the Pacific Northwest as a whole, the number of frost days is decreasing.
-JN
** Bulletin of the American Meteorological Society. The paper is "Recent Changes in Frost Days and the Frost-Free Season in the United States". See the paper online at
http://journals.ametsoc.org/doi/pdf/10.1175/1520-0477(2002)083%3C1327%3ARCIFDA%3E2.3.CO%3B2
*** See http://cdiac.ornl.gov/epubs/ndp/ushcn/ushcn.html
Other data, not going back as far, but having some built-in tools to find frost and ice days are here: http://www.wrcc.dri.edu/cgi-bin/sod_xtrmts2x.pl
